This tutorial shows how to setup a Java development environment in Visual Studio Code on Windows. Create a new class, edit the code and use the Java debugger.
The only pre-requisite is to have Visual Studio Code installed.
Extension Pack for Java
The first thing to do is to install the “Extension Pack for Java”; that’s a package that includes a few extensions for Visual Studio Code.
Open the Extensions tab using the keyboard shortcut Ctrl + Shift + X.

Search for Extension Pack for Java and click Install.
Install JDK
Once the extensions are installed, you’re prompted with a dialog to install a JDK.
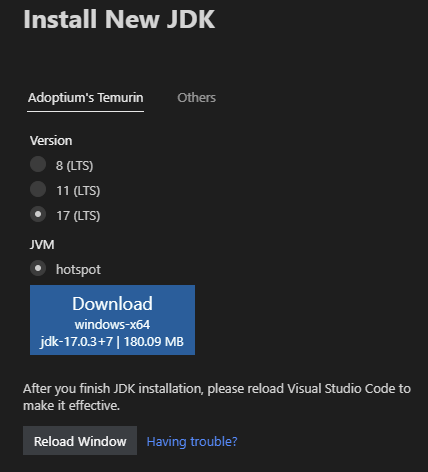
Reloading the Visual Studio Code window is necessary but often not enough to make the change effective. You will have to make sure there isn’t any other pre-existing JDK in the PATH environment variable.
To check which java version you’re currently using you can run the classical instruction in the Visual Studio Code terminal:
java -versionWhen this is not enough and you want to know exactly which Java executable is being used, you can run the following instruction in a Command Prompt.
for %i in (java.exe) do @echo. %~$PATH:iCreate a Project
The simplest way to get started with coding is to create a new Java project by following the wizard “Create Java Project”.
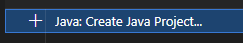
This is straightforward and creates a simple Java application which contains a “Hello World” class.
The App class is ready to run. Running the application in debug mode and setting a breakpoint is as easy as it should be and surprisingly similar to standard Java IDEs such as IntelliJ Idea.
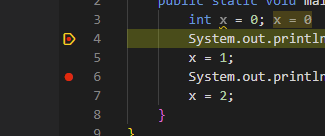
Debugger
The debugger has, at a first glance, everything that is expected from such a tool.
A click to the left of any line of code adds/removes breakpoints.
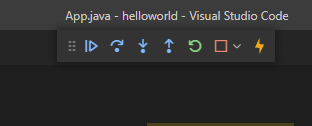
Right at the top-center of the screen, a toolbar shows the classical debug commands such as Continue, Step-over, Step-into.
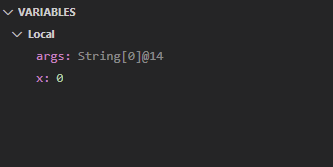
The local variables, with their values, are visible by default in the left column.
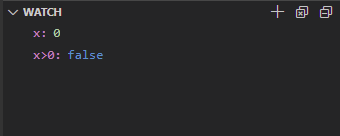
If that’s not enough, it’s possible to add expressions in the Watch panel.
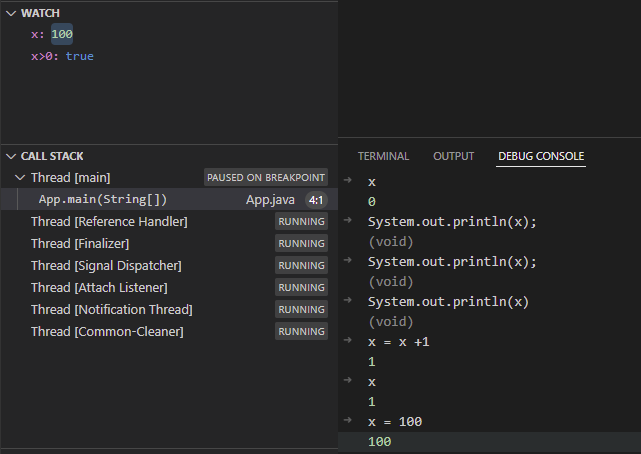
The cherry on top is the Debug Console where it’s possible to modify the value of the local variables at runtime.
In this tutorial we discussed how to setup a basic Java development environment in Visual Studio Code, how to install a JDK, create and execute a simple Java application. Then we had a look at the main commands of the Debugger tool; how to add and remove breakpoints, control the execution, keep track of the values of local variables and modify them on the fly.